Stock Forecasting Products: Packaged CSV files and its associated graphs
Variety of stock forecasting data in csv format includes
- Daily stock forecasting
- Forecasting daily close price for specific days, for example 50 days. This is for short term trading so beyond 50 trading days may not be very useful. Still, any specific range of forecasting days is possible.
- Because this makes more sense for more volatile stocks, it is focused on high volatile stocks over entire US stocks and limited index funds. Still, clients can ask for their own stocks for forecasting purpose.
- Because TASoft LLC forecasting requires significant amount of historical daily trading data, it forecasts stocks with existence beyond 1000 trading days.
- Packaged products include csv file and associated forecasting graph. Clients can also plot forecasting graph using excel sheet.
- Weekly/Monthly stock forecasting
- Forecasting weekly/monthly stock price for specific weeks/months, for example 50 weeks.
- This is suitable for long-term trading so all type of stocks are included (mutual funds can be included as well).
- Because of business constraint, currently this option is not available.
Forecasting CSV sample product on stock CEI:
- Forecasting 100 trading days on CEI day close price. First 50 days are for accuracy verification so
they are existing historical data. Last 50 days are for real time forecasting.
- Forecasting was performed on 2022-2-6.
- From 2021-11-24 to 2022-2-6, forecasting are on existing historical data for accuracy verification purpose.
- Forecasting 50 trading days from 2022-2-7 are for real time trading price.
- From 2021-11-24 to 2022-2-6, forecasting are on existing historical data for accuracy verification purpose.
- Forecasting 50 trading days from 2022-2-7 are for real time trading price.
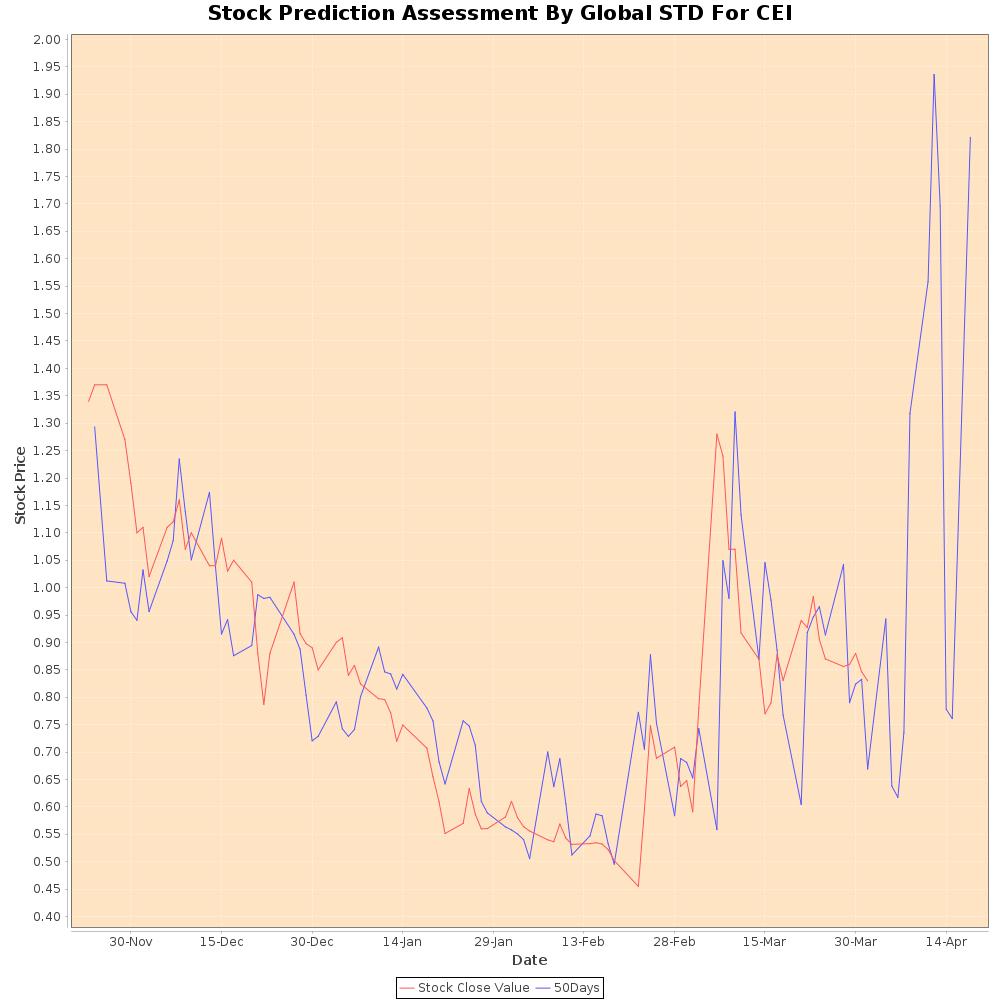
CEI Forecasting CSV data
CEI Forecasting Corresponding Graph